VSTS 2010: Enabling Test Impact Analysis

A really cool new feature in VSTS 2010 is Test Impact Analysis which let developers view what tests that are affected by the current code changes. Pieter Gheysens wrote a blog post on how to set this up in the CTP, but things have changed a bit in Beta 1 so I thought that I would show how it is done. Since it still is a bit unintuitive to enable it, it might change once again in the RTM. The reason that it is a bit unintuitive to set it up, is because you need to have the following things:

  • You must use Test Metadata files when running your tests. You can’t use Test Assemblies
  • You must have code coverage enabled in your test settings. VSTS use the code coverage information from a test run to determine which tests that are impacted by a code change.
  • You must setup a team build in TFS with test impact analysis enabled. The build will publish the test results including the code coverage information and VSTS will read information from this build.

So, lets set it up:

  1. First you will (obviously) need a solution containing some tests. Note that I don’t explicitly write unit tests here, because it might as well for example web tests. Check in your solution.
  2. Enable Code Coverage for you current test settings. See my previous post on how to do this
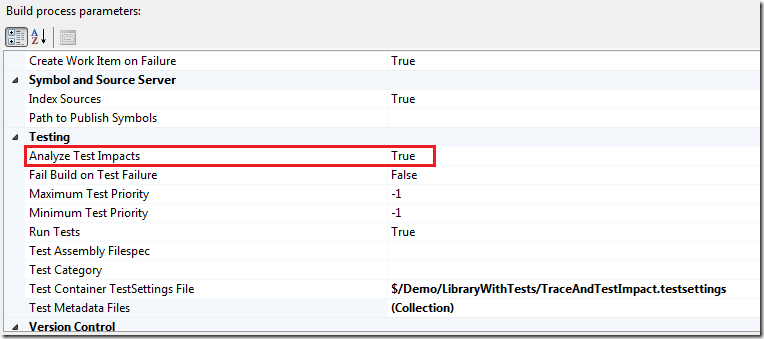
  3. Create a new team build and select your solution. Then set the Analyze Test Impacts parameter to true
    image

  4. Select the Test Container TestSettings File and make sure that it is the one in which you have enabled code coverage. In the figure above, I have selected $/Demo/LibraryWithTests/TraceAndTestImpact.testsettings

  5. Save the build definition and queue a new build. Make sure it finishes successfully and that the tests were executed
  6. Now, change some code that you know is called by one or more tests.
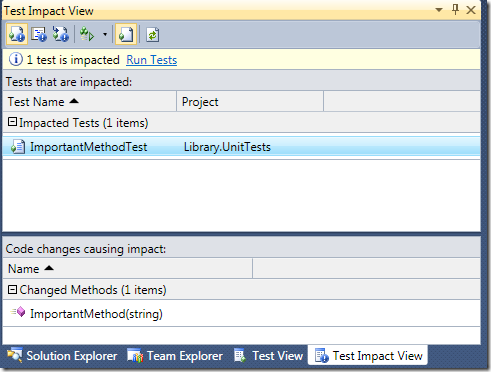
  7. Switch to the Test Impact View, that is located in the Test –> Windows submenu. First off you can select the button on the top left, called  Show Impacted Tests, that will show all tests that are impacted by all your current code changes.In this case, one test was impacted (ImportedMethodTest). When you select the test, you can see in the bottom part of view what code changes that caused the impact
    image

    The next button  is called Show Code Changes and shows the opposite information, e.g. what code changes that has been done, and for each code change it lists the affected test.
    Note that there is Run Tests link in the view. This is also available as a button. This lets you run all the tests that are affected by your code change. This is a very nice feature, that will speed up your development considerably (at least if you have many tests….)

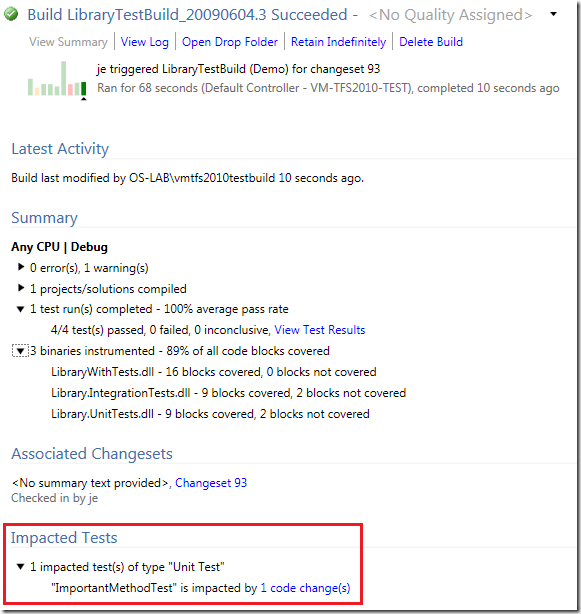
  8. Check in your code change and queue a new build. When the build finishes, open the build summary. This will show you, in addition to the test and code coverage information, what tests that were impacted.
    image

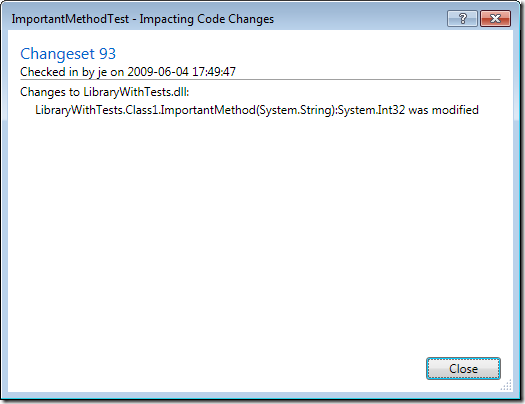
    If you click the 1 code change(s) link next to the test, a dialog that lists all the methods that had impact on that test is shown
    image

TFS Team Build 2010: Executing Unit Tests

There are some changes and improvements in the area of executing unit tests in Team Build 2010. Mostly the changes make it easier to define which unit tests you want to execute as part of the build. In this post I will go through the different options that you have when it comes to running unit tests and enabling code coverage.

To configure test settings for a Team Build, you select Edit Build Definition in Team Explorer, and then go to the Build Process tab. In the Build process parameters box there is a section for the testing parameters. To change the parameters, just edit them and hit the save button. There is no need to check anything in or out to change the parameters. Only changes to the build process require you to check in the build process file (.xaml)


Running Unit Tests from Test List(s)
If you like to manage your tests using test lists (I don’t!), this option lets you run all the tests from one or more test lists. Here I have created two test lists, ImportantTests and LessImportantTests. Each test list contains two unit tests from two different assemblies.

image

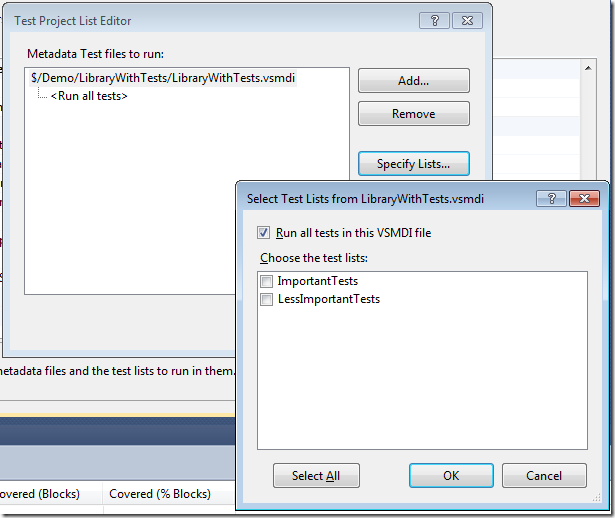
To run all the tests from these test lists in a team build, locate the Test Metadata Files parameter and press the browse button to the right. This brings up a dialog that lets you choose which test metadata files (.vsmdi files) that you want to execute tests from. By default, all the tests will be executed. To filter this, click the Specify Lists button and you can select one or more test lists instead:


image


Running Unit Tests from Test Assemblies (a.k.a. Test Containers)
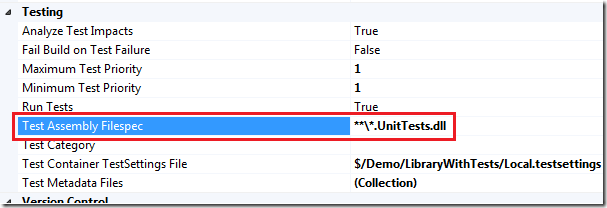
Since managing test lists in VSTS doesn’t scale very well, a common approach is to use Test Assemblies instead. In previous versions this was called Test Containers. So instead of creating different test lists to group your tests, you create several unit test assemblies and group your unit tests by adding them to the corresponding unit test assembly. For example you can have one (or more) assembly that contain pure unit tests, another set of assemblies that contain integration tests that you might only want to run in your nightly builds. To specify which test assemblies you want to execute, you use the Test Assembly Filespec parameter. This parameters contains a search pattern that should match the names of your test assemblies.


image

To use this approach in your company, you need to define a naming scheme for your unit test assemblies, such as Project.UnitTests.dll, Project.IntegrationTests.dll and so on.


Running Unit Tests by Priority
In addition to selecting which unit tests to execute, you can now further filter the tests by using the Priority attribute on your test methods. This is an attribute that has been around since .NET 2.0, but strangely enough there was no support of using it when running tests, neither in Visual Studio or in Team Build. In TFS 2010 however you can define a minimum and maximum test priority for your team build, meaning that all tests with a priority within that range will be executed as part of the build.


Here is how you decorate your test method with a priority.

/// <summary>

 ///A test for ImportantMethod

 ///</summary>

 [TestMethod()]

 [DeploymentItem("LibraryWithTests.dll")]

 [Priority(1)]

 public void ImportantMethodTest()

 {

     Class1 target = new Class1(); // TODO: Initialize to an appropriate value

     string arg = "42"; // TODO: Initialize to an appropriate value

     int expected = 42; // TODO: Initialize to an appropriate value

     int actual;

     actual = target.ImportantMethod(arg);

     Assert.AreEqual(expected, actual);

 }


Then, set the priority range in your build definition

image

Note that this is an additional filter that is applied to, in this case, all unit tests in all test assemblies that end with UnitTests.dll.


Running Unit Tests by Category
In addition to Priority, you can also filter your tests by using categories. This is very similar to priorities, but instead of working with numeric ranges, you define categories with meaningful names and apply them to your test methods.

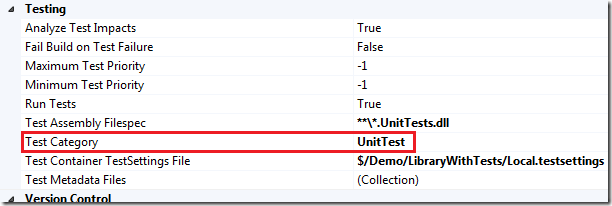
To use this approach, decorate your test methods with the TestCategory attribute and then specify one or more test categories in your build definition.


image

According to the tooltip you should be able to construct the filter by using logical operators such as & and | , but this doesn’t seem to work in Beta 1.

Enabling Code Coverage in a Team Build


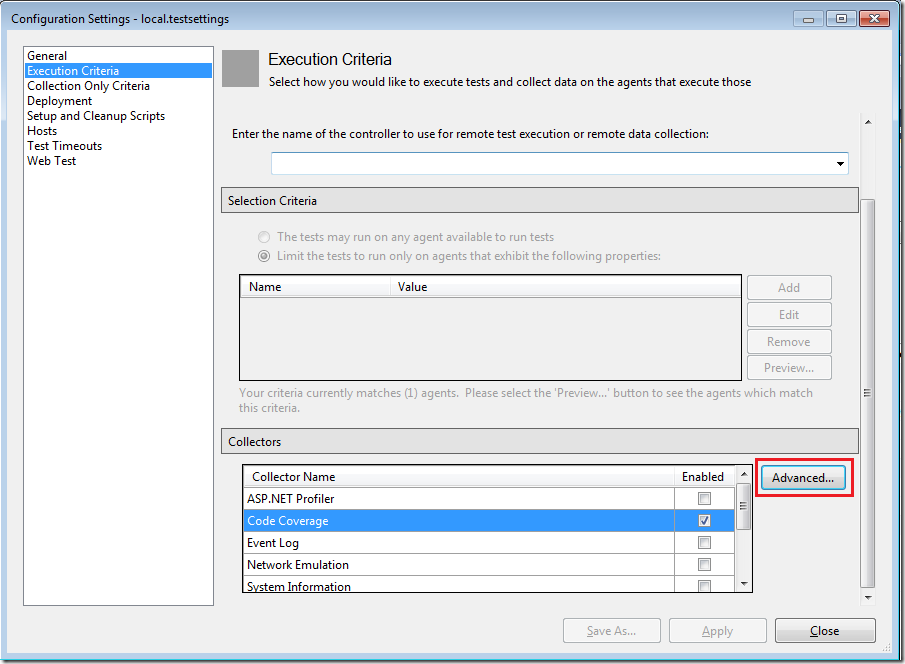
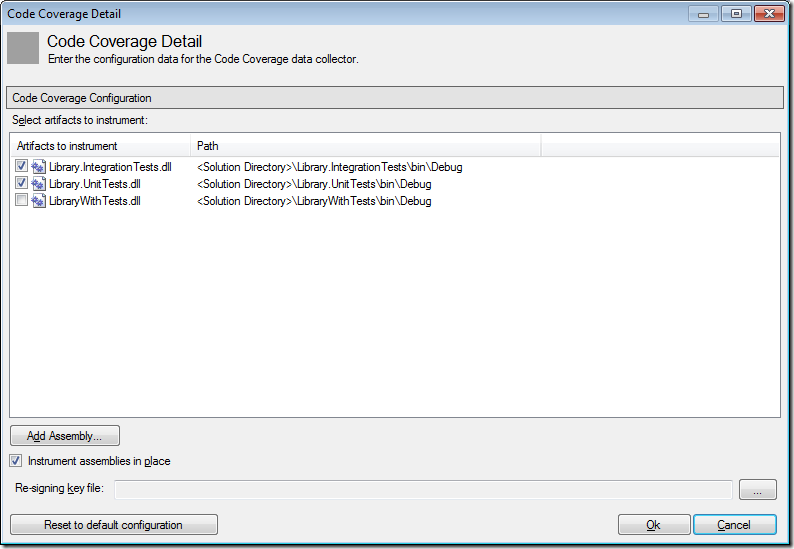
When running unit tests you normally want to know how much of your code is actually tested, a.k.a. code coverage. The way you enable this for your tests and in your team build has changed a bit. First, the previous *.testrunconfig files has been renamed into *.testsettings. To enable code coverage, double click on your .TestSettings file and select the Execution Criteria tab. Here you will see a totally new Collectors section that contains information about what data you want to collect when executing test. One of them is code coverage. The GUI is a bit weird in Beta 1, since you are supposed to first select the Code Coverage checkbox, and then click the Advanced button to specify which assemblies that should be instrumented for code coverage.

image


image


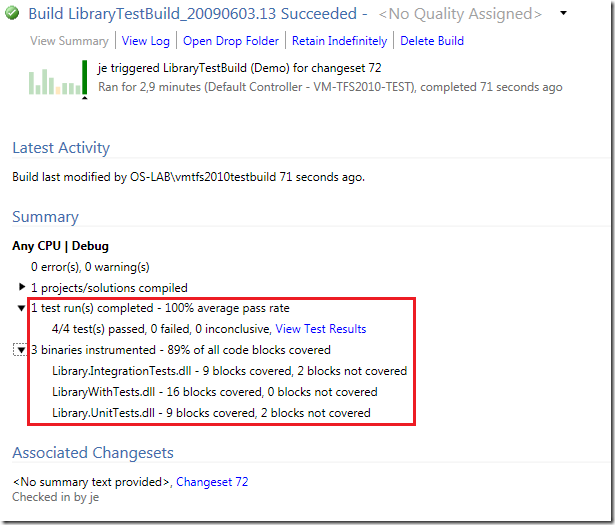
Next, in your team build definition you must specify the name of the test settings file you want to use. This is done using the Test Container TestSettings File parameter. Save the build definition, check in the test settings file and queue a new build. When it has finished, open the build summary that will show you the numbers on number of executed/passed/failed tests, and also the overall code coverage.


 image


Very nice summary view indeed! If you want to look at the test results in detail, you click the “View Test Results” link which will download the test run to your local machine and then open it in the Test Results window.