The build process template and custom activity described in this post is available here:
http://cid-ee034c9f620cd58d.office.live.com/self.aspx/BlogSamples/Inmeta%20TFS%20Build%20Sample.zip
Running code metrics has been available since VS 2008, but only from inside the IDE. Yesterday Microsoft finally released Visual Studio Code Metrics Power Tool 10.0, a command line tool that lets you run code metrics on your applications. This means that it is now possible to perform code metrics analysis on the build server as part of your nightly/QA builds. In this post I will show how you can run the metrics command line tool from a build, and also a custom activity that reads the output and appends the results to the build log, and fails the build if the metric values exceeds certain (configurable) treshold values.
The code metrics tool analyzes all the methods in the assemblies, measuring cyclomatic complexity, class coupling, depth of inheritance and lines of code. Then it calculates a Maintainability Index from these values that is a measure of how maintanable this method is, between 0 (worst) and 100 (best). For information on how this value is calculated, see http://blogs.msdn.com/b/codeanalysis/archive/2007/11/20/maintainability-index-range-and-meaning.aspx. After this it aggregates the information and present it at the class, namespace and module level as well.
Running Metrics.exe in a build definition
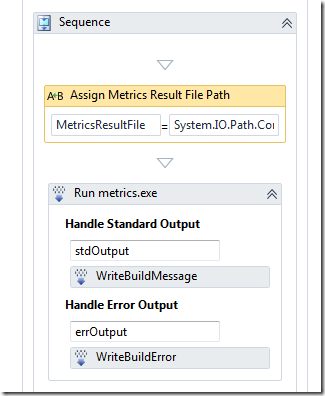
Running the actual tool is easy, just use a InvokeProcess activity last in the Compile the Project sequence, reference the metrics.exe file and pass the correct arguments and you will end up with a result XML file in the drop directory. Here is how it is done in the attached build process template:
In the above sequence I first assign the path to the code metrics result file ([BinariesDirectory]result.xml) to a variable called MetricsResultFile, which is then sent to the InvokeProcess activity in the Arguments property.
Here are the arguments for the InvokeProcess activity:
Note that we tell metrics.exe to analyze all assemblies located in the Binaries folder. You might want to do some more intelligent filtering here, you probably don’t want to analyze all 3rd party assemblies for example.
Note also the path to the metrics.exe, this is the default location when you install the Code Metrics power tool. You must of course install the power tool on all build servers.
Using the standard output logging (in the Handle Standard Output/Handle Error Output sections), we get the following output when running the build:
Integrating Code Metrics into the build
Having the results available next to the build result is nice, but we want to have results integrated in the build result itself, and also to affect the outcome of the build. The point of having QA builds that measure, for example, code metrics is to make it very clear how the code being built measures up to the standards of the project/company. Just having a XML file available in the drop location will not cause the developers to improve their code, but a (partially) failing build will! ![]()
To do this, we need to write a custom activity that parses the metrics result file, logs it to the build log and fails the build if the values frfom the metrics is below/above some predefined treshold values.
The custom activity performs the following steps
- Parses the XML. I’m using Linq 2 XSD for this. Since the XML schema for the result file is available with the power tool, it is vey easy to generate code that lets you query the structure using standard Linq operators.
- Runs through the metric result hierarchy and logs the metrics for each level and also verifies maintainability index and the cyclomatic complexity against the treshold values. The treshold values are defined in the build process template and are sent in as arguments to the custom activity
- If the treshold limits are exceeded, the activity either fails or partially fails the current build.
For more information about the structure of the code metrics result file, read Cameron Skinner’s post about it. It is very simple and easy to understand. I won’t go through the code of the custom activity here, since there is nothing special about it and it is available for download so you can look at it and play with it yourself.
The treshold values for Maintainability Index and Cyclomatic Complexity is defined in the build process template, and can be modified per build definition:
I have chosen the default values for these settings based on a post from my colleague Terje Sandström – Code Metrics – suggestions for approriate limits. When you think about it, this is quite an improvement compared to using code metrics inside the IDE, where the Red/Yellow/Green limits are fixed (and the default values are somewhat strange, see Terjes post for a discussion on this)
This is the first version of the code metrics integration with TFS 2010 Build, I will probably enhance the functionality and the logging (the “tree view” structure in the log becomes quite hard to read) soon.
I will also consider adding it to the Community TFS Build Extensions site when it becomes a bit more mature.
Another obvious improvement is to extend the data warehouse of TFS and push the metric results back to the warehouse and make it visible in the reports.


